Jacob Butler
Are you killing fish by accident? As many people know, trout can be finicky and may seem like they die just by looking at them—but why is this? Trout are a cold-water fish species that depend on cool, oxygen-rich environments. As waters warm during the summer months, oxygen levels drop and fish metabolisms speed up. These warmer temperatures cause trout to divert energy toward stress responses instead of growth and energy storage, leading to reduced energy reserves, poorer growth, or even death in extreme situations.
This brings us to the Ausable River, where tourists from all over come to fish for the well-known brown trout. The best time to fish for trout is typically in the spring or fall, but some anglers still fish during the warmer summer months. Fishing for trout is safest when water temperatures are below 65°F (18°C). When temperatures rise to 65–67°F, trout begin to experience negative effects. Because of this, it is best to fish early in the morning when temperatures are lower and to use heavier equipment, pinch barbs, and to land fish as quickly as possible. Proper fish-handling practices should always be followed. Once water temperatures reach 68°F (20°C), trout show significant signs of stress, and fishing for them should be avoided altogether.
How It Was Made
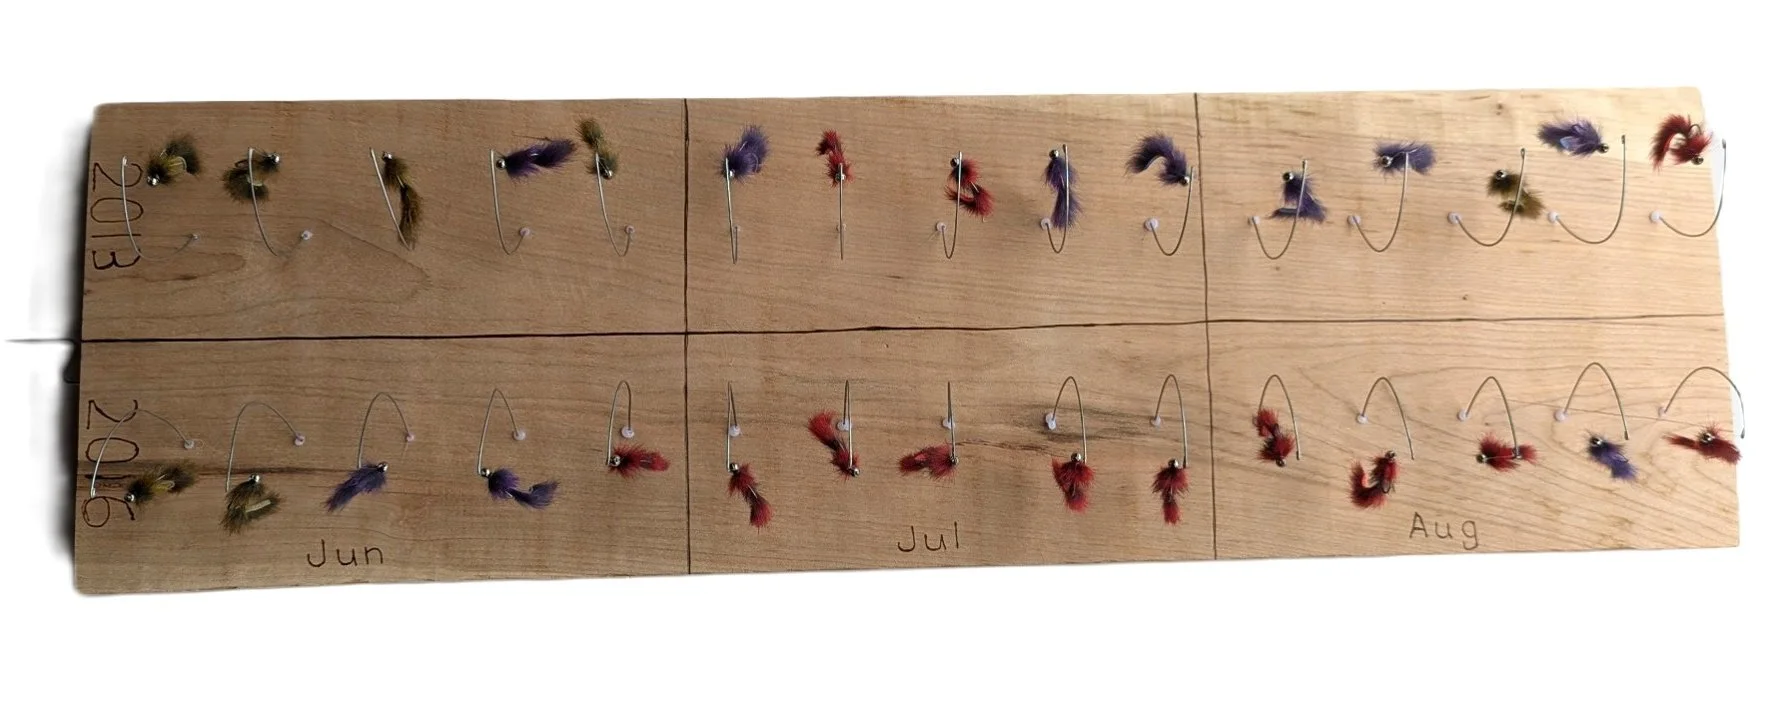
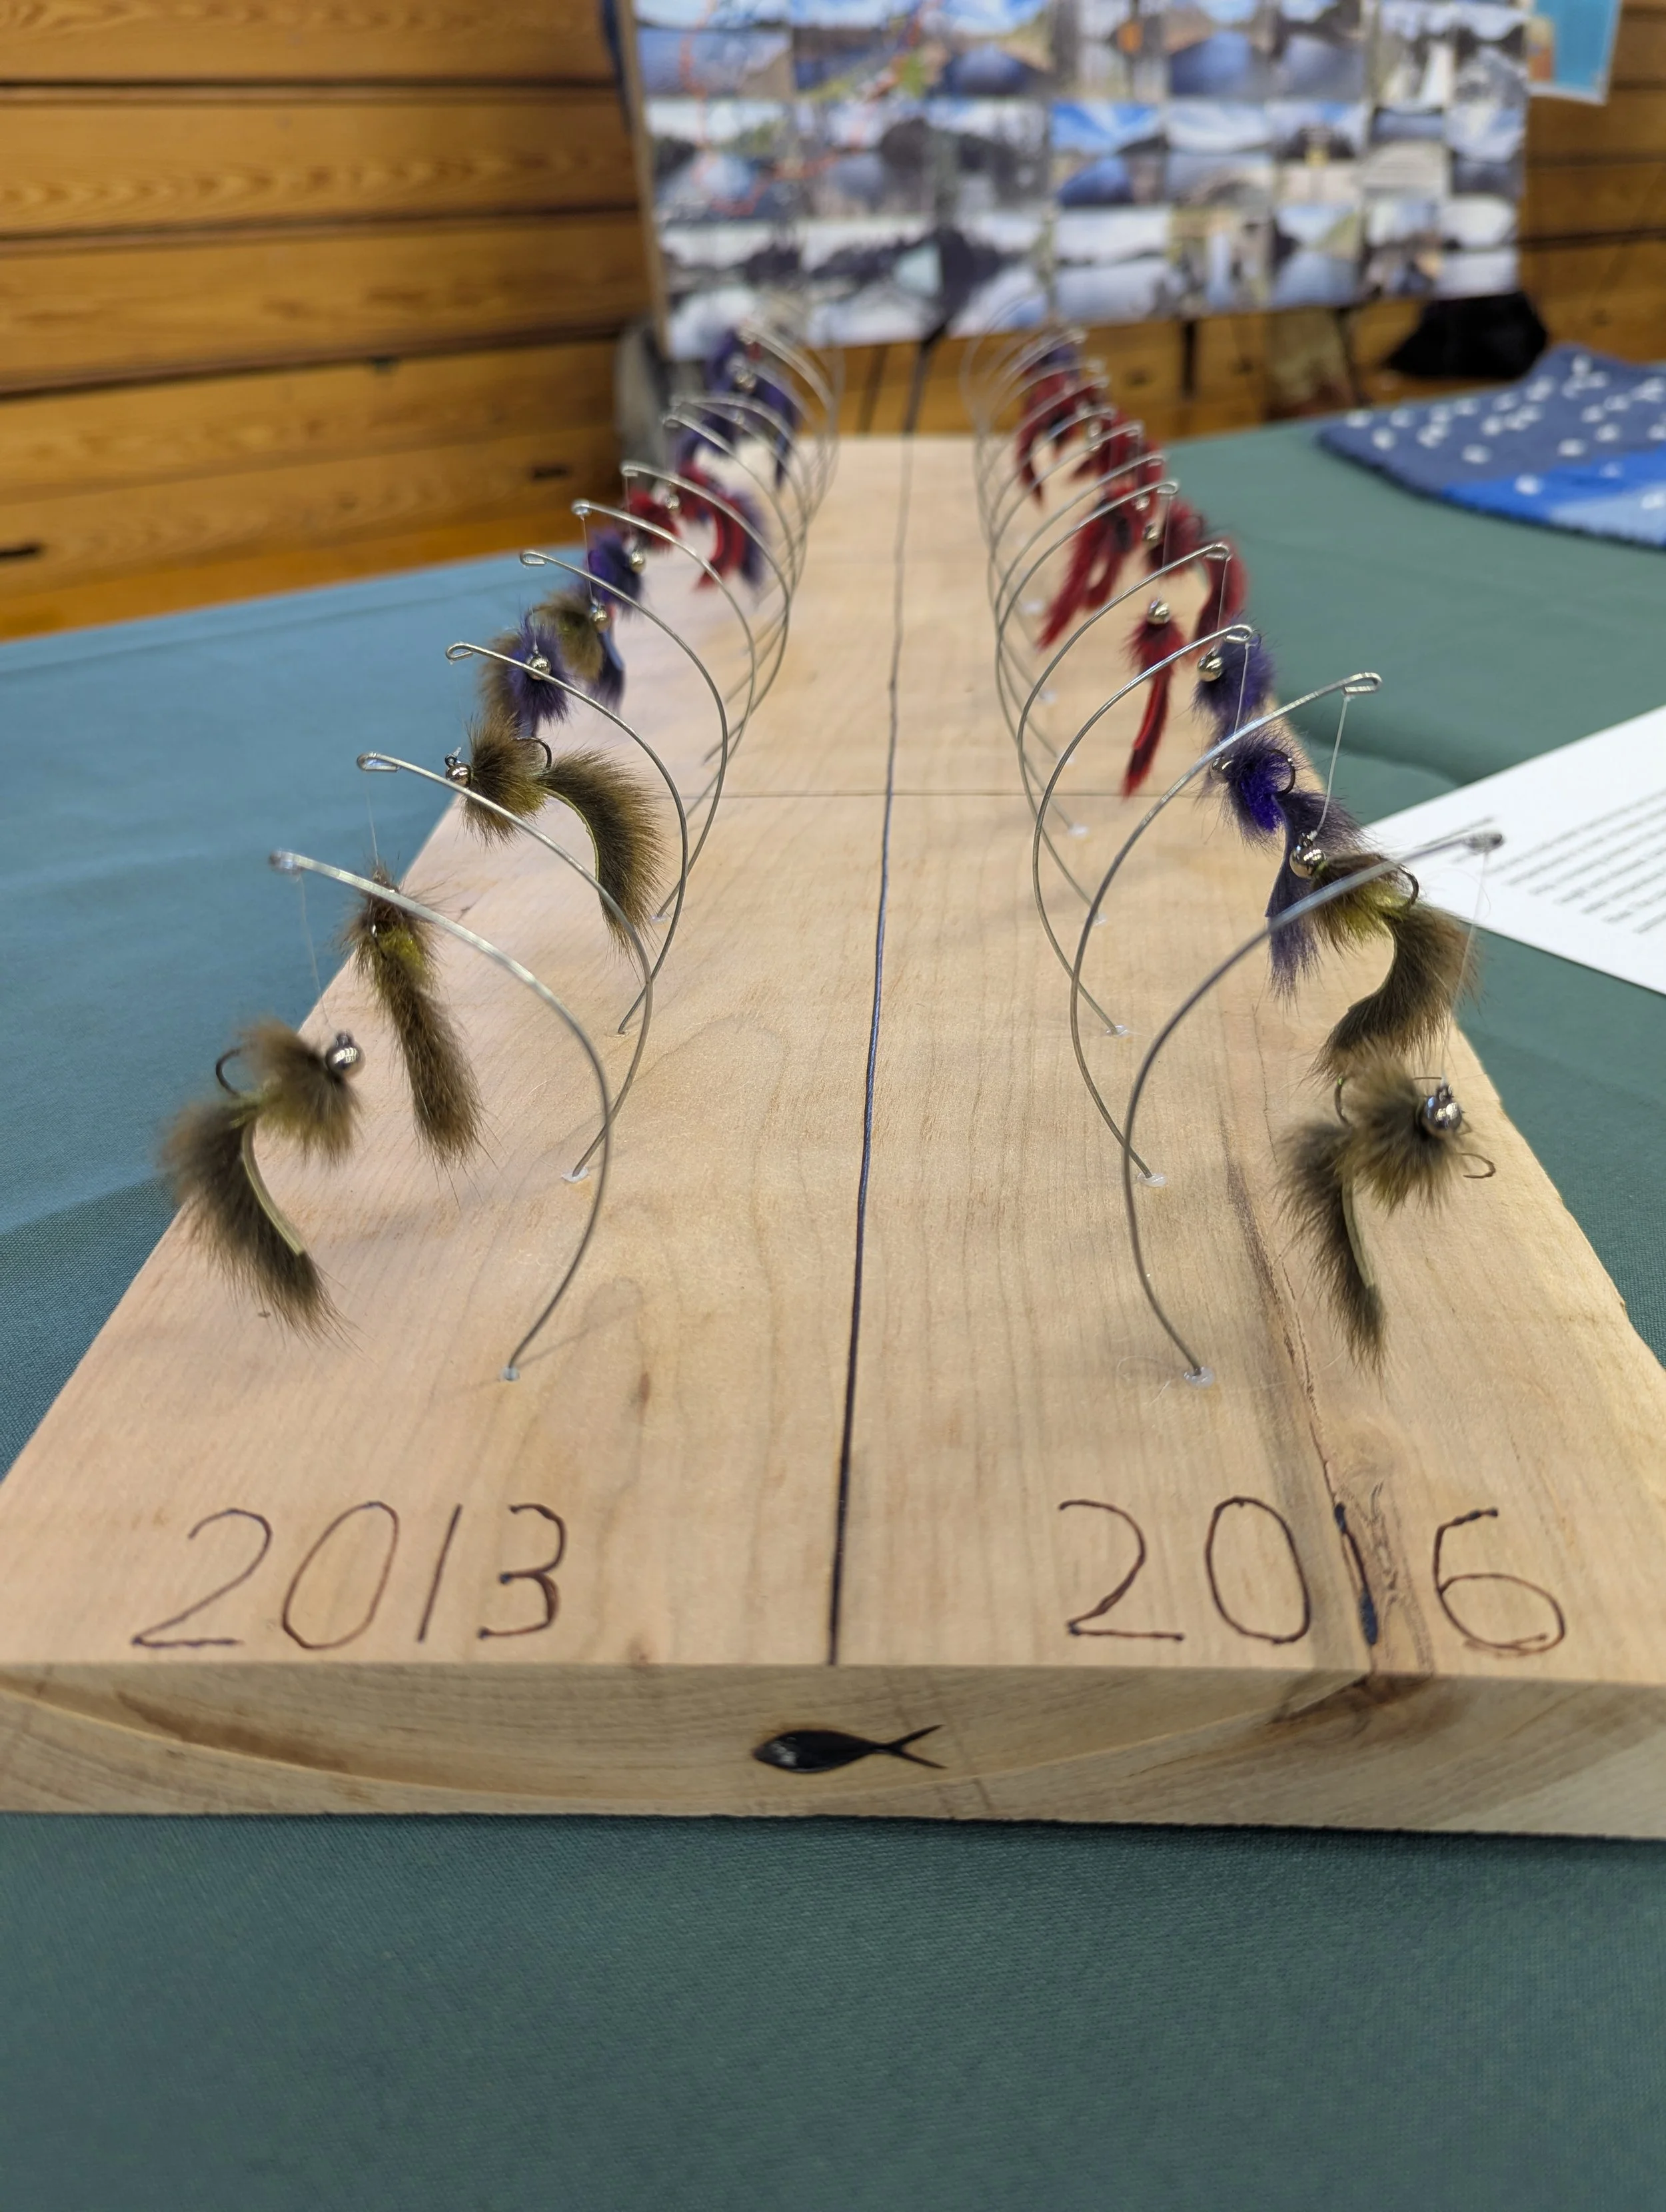
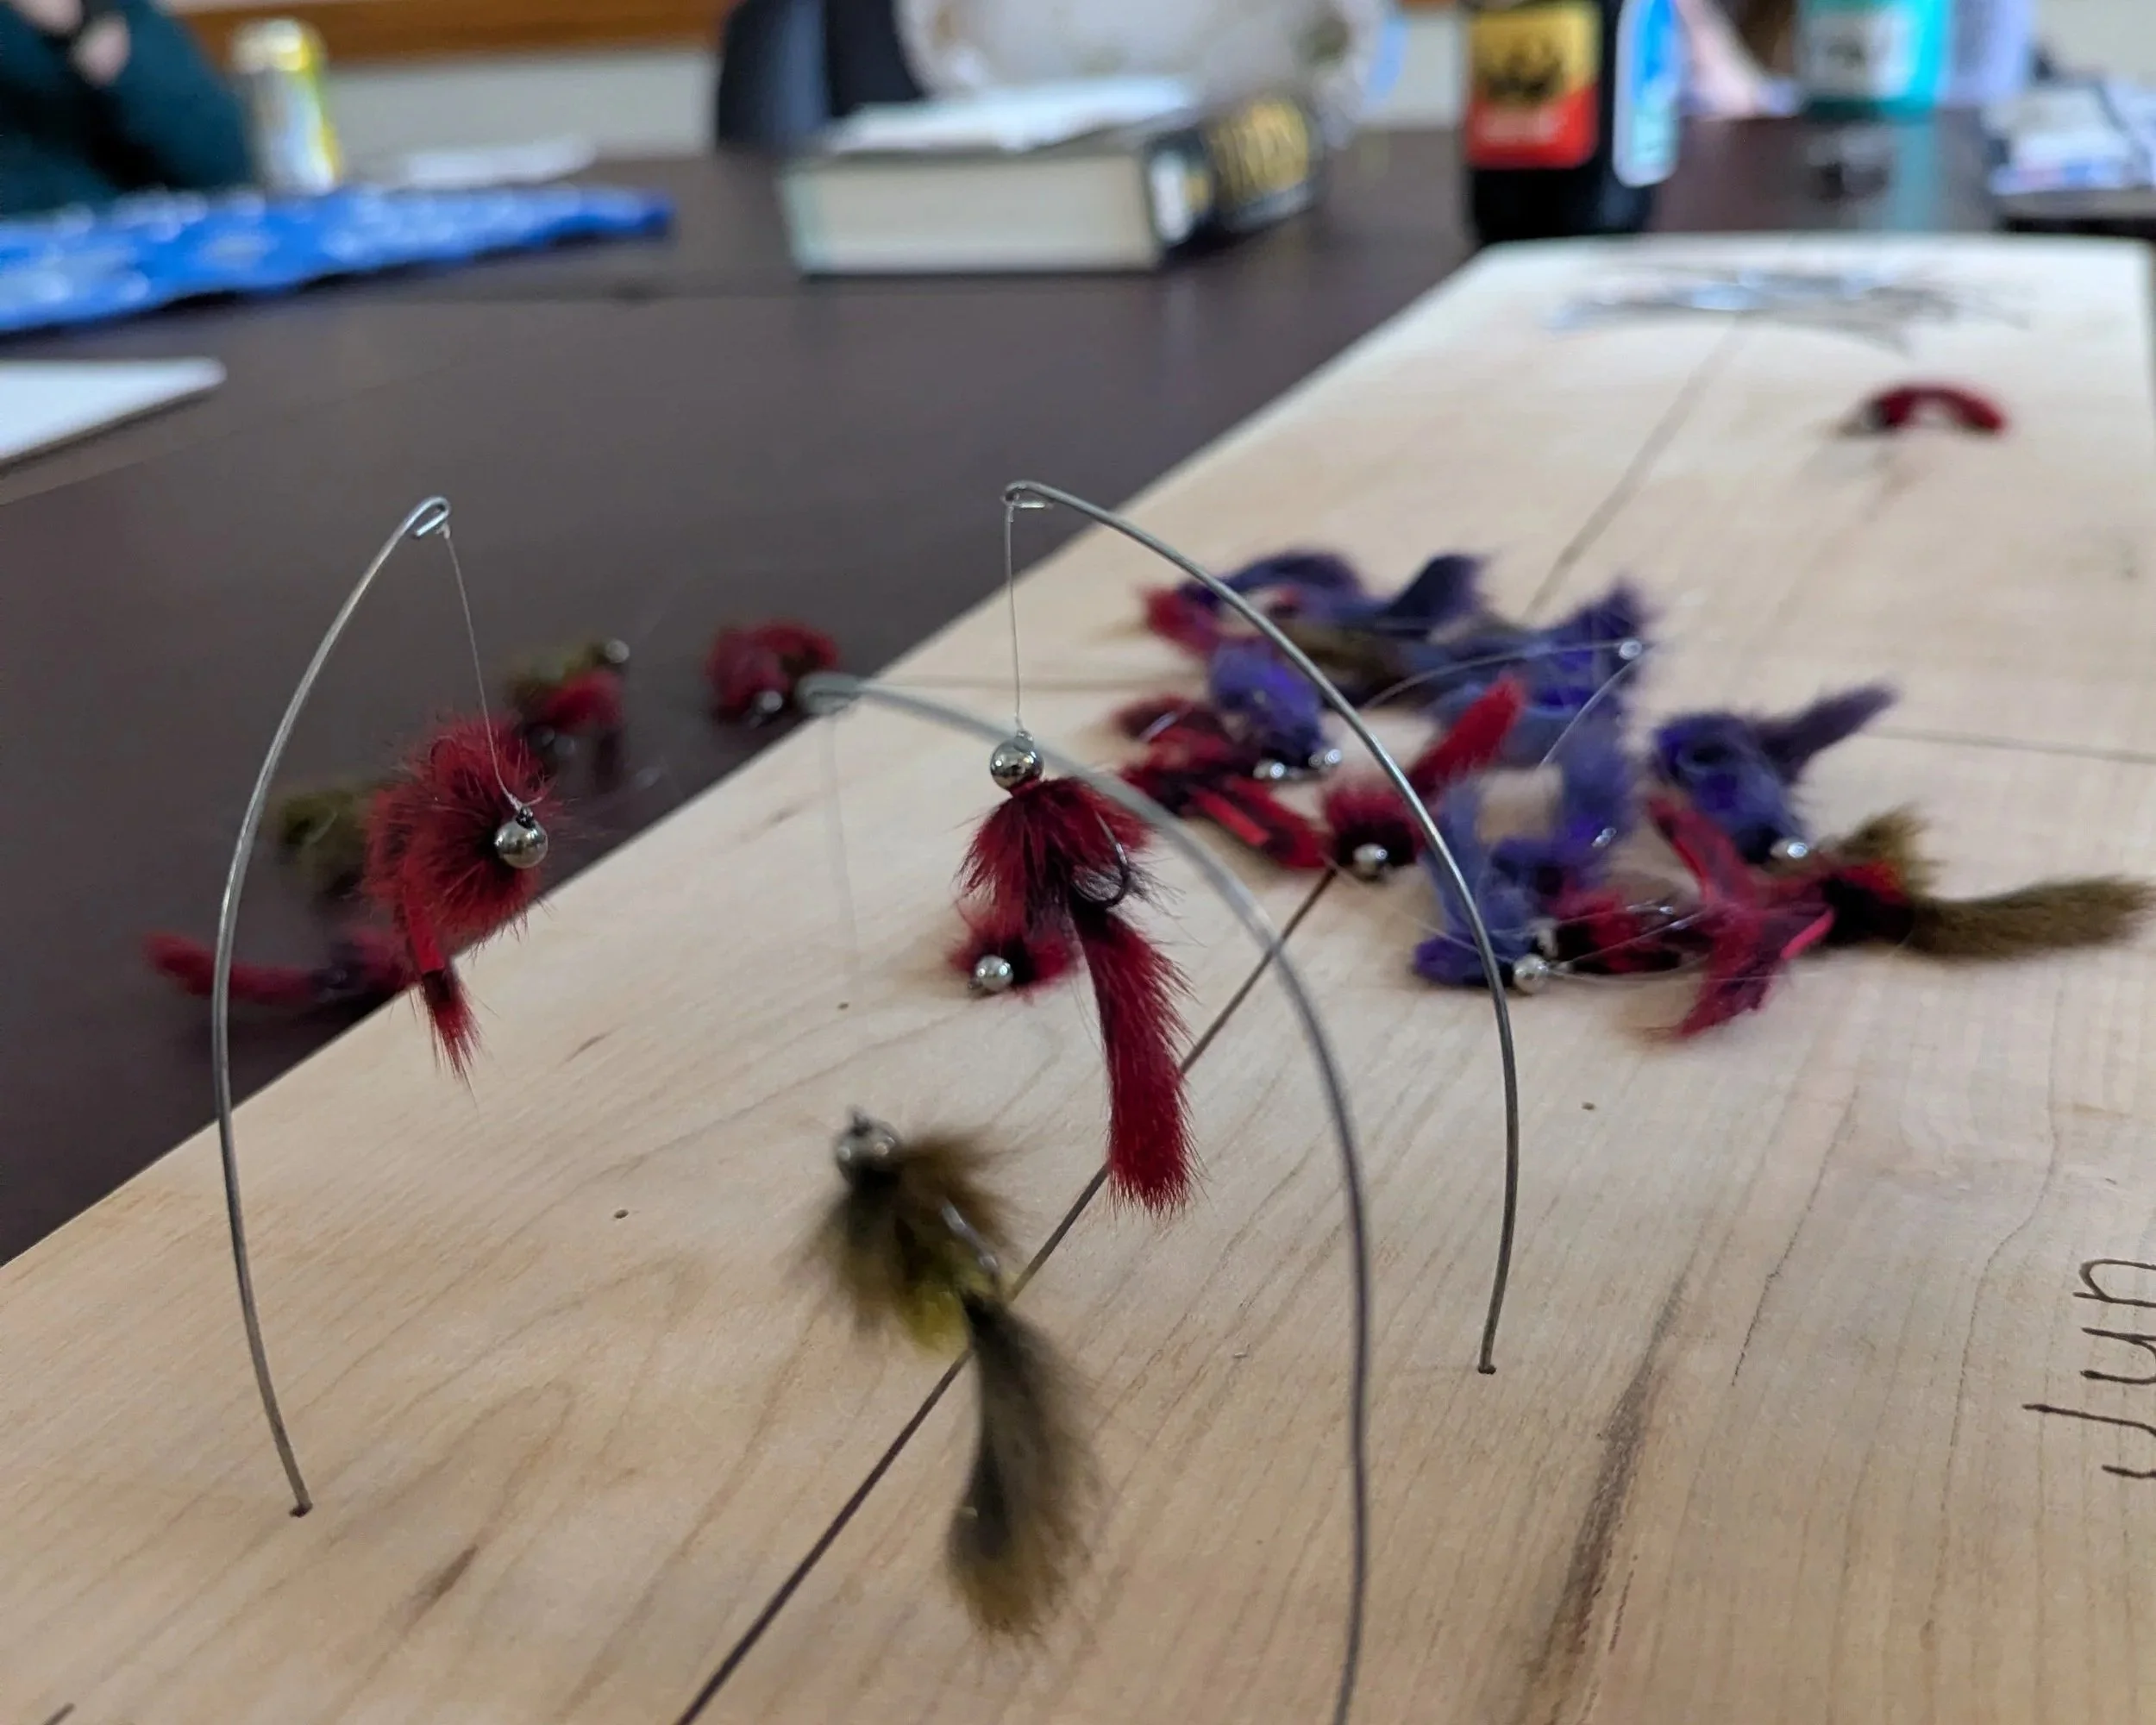
My art piece is made from scrap wood sourced from our school makerspace. The flies were tied by me, and wire was used to suspend them. The base, as mentioned, is made from leftover wood. I sanded the rough-cut board, starting with 80-grit sandpaper and working up to 320-grit to achieve a smooth finish. Once the board was prepared, I measured and marked evenly spaced positions for 15 flies arranged in two rows. After marking the locations with a pencil, I used a drill to create holes for the mini fishing poles.
After drilling the holes, I used a wood burner to label the board with years and month abbreviations. This was done freehand. The fly I chose for this project was Lance Egan’s Poacher. I selected this fly because I felt comfortable tying multiple versions of it, and it is large enough to catch people’s attention. It can also be tied in a variety of colors, allowing it to stand out visually.
To create the flies, I used size 8 jig hooks, 4.6 mm beads, matching colored thread, pine squirrel zonkers, and dubbing. I chose red to represent hot days, as it is commonly associated with heat and signals stopping or danger. Green was chosen to represent safe fishing conditions, symbolizing a “green light to fish.” Purple represents the in-between range, as colors like orange were too similar to red, and I wanted each category to stand out. The poles that hold up the flies were made from wire and secured into the wooden base with hot glue. The flies were attached using five-pound fluorocarbon tippet.
The Data
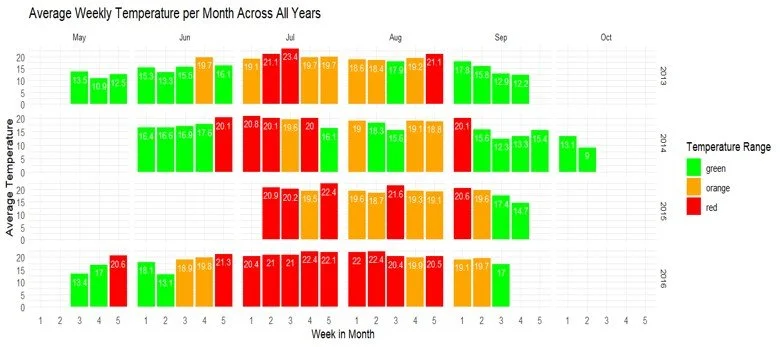
The data used in this project comes from the EcoSHEDS Northeast Stream Temperature Database. I selected a gauge from the West Branch of the Ausable River near Whiteface Mountain, as this is a popular fishing area with sufficient available data. The data were downloaded and entered into an Excel spreadsheet, where I used a pivot table to organize and sort the information I needed. After organizing the data, I used RStudio to generate a rough graph connected to the Excel file. This graph sorted the data by year, month, and temperature ranges, using colors that correspond to the physical art piece. I used data from the graph in the years 2013 and 2016, as these years provided enough consistent and consecutive data for analysis.
Conclusion
The goal of this project is to help people recognize that their actions while fishing, especially during the warmer months, can unintentionally harm the very fish they value. Many anglers assume that if a fish swims away after being caught, it has survived without issue. However, this project highlights how elevated water temperatures place trout under significant physiological stress, reducing their chances of survival even after release. By connecting scientific data with a visual art piece, this work helps the audience better understand how temperature directly affects trout health and behavior.
In the future, I would like to expand this project by working with data from another river, such as the Delaware River, and by using a much longer time range. For example, analyzing data from the late 1900s to the present would allow for a deeper understanding of long-term temperature trends. I would also like to run a t-test to determine whether there is a correlation between average water temperature and year, helping to identify whether stream temperatures are increasing over time. Based on the limited data I used in this project, it appeared that temperatures were rising each year and lasting for longer periods, but a larger dataset would be needed to confirm this pattern. Additionally, I would like to work with a full year of data rather than selected months to provide a more complete and accurate representation of temperature changes throughout the year.
Ultimately, this project encourages anglers to think more carefully about when and how they fish, and to consider the environmental conditions that impact fish survival.