
Wind Throw
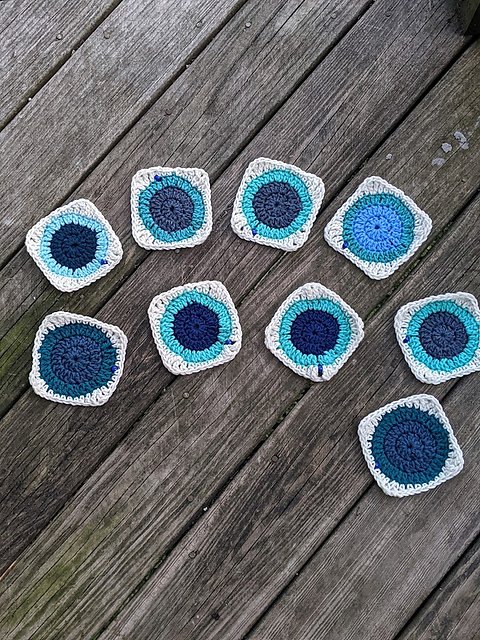
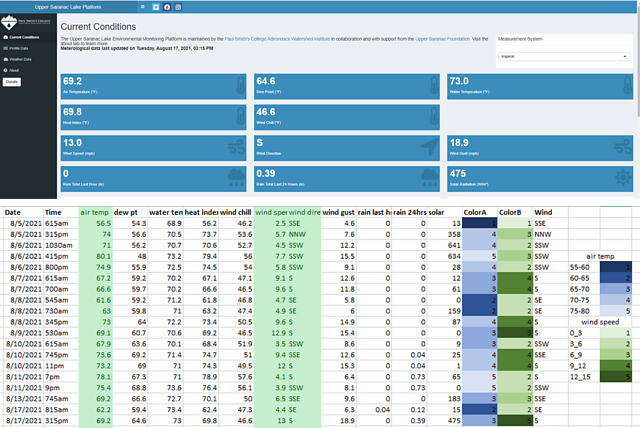
This piece is meant to provide an example of a day-to-day representation and accumulation of weather data that could be added to for as long as its creator was interested. Weather information was obtained from our Upper Saranac Lake Monitoring Platform. Each instance of recorded data is represented in a crochet square in which a central circle (blues) represents a range of air temperatures, a second circle (greens) illustrates a range of wind speeds, and a bead marks the wind direction at the time of the reading. This method could be translated to any number of weather parameters, over the course of any time period, to create anything from a scarf to a blanket.
More info available here on Ravelry.